9 Hypothesis testing and p-values
Before diving into statistical tests, let’s take a moment to appreciate the bigger picture.
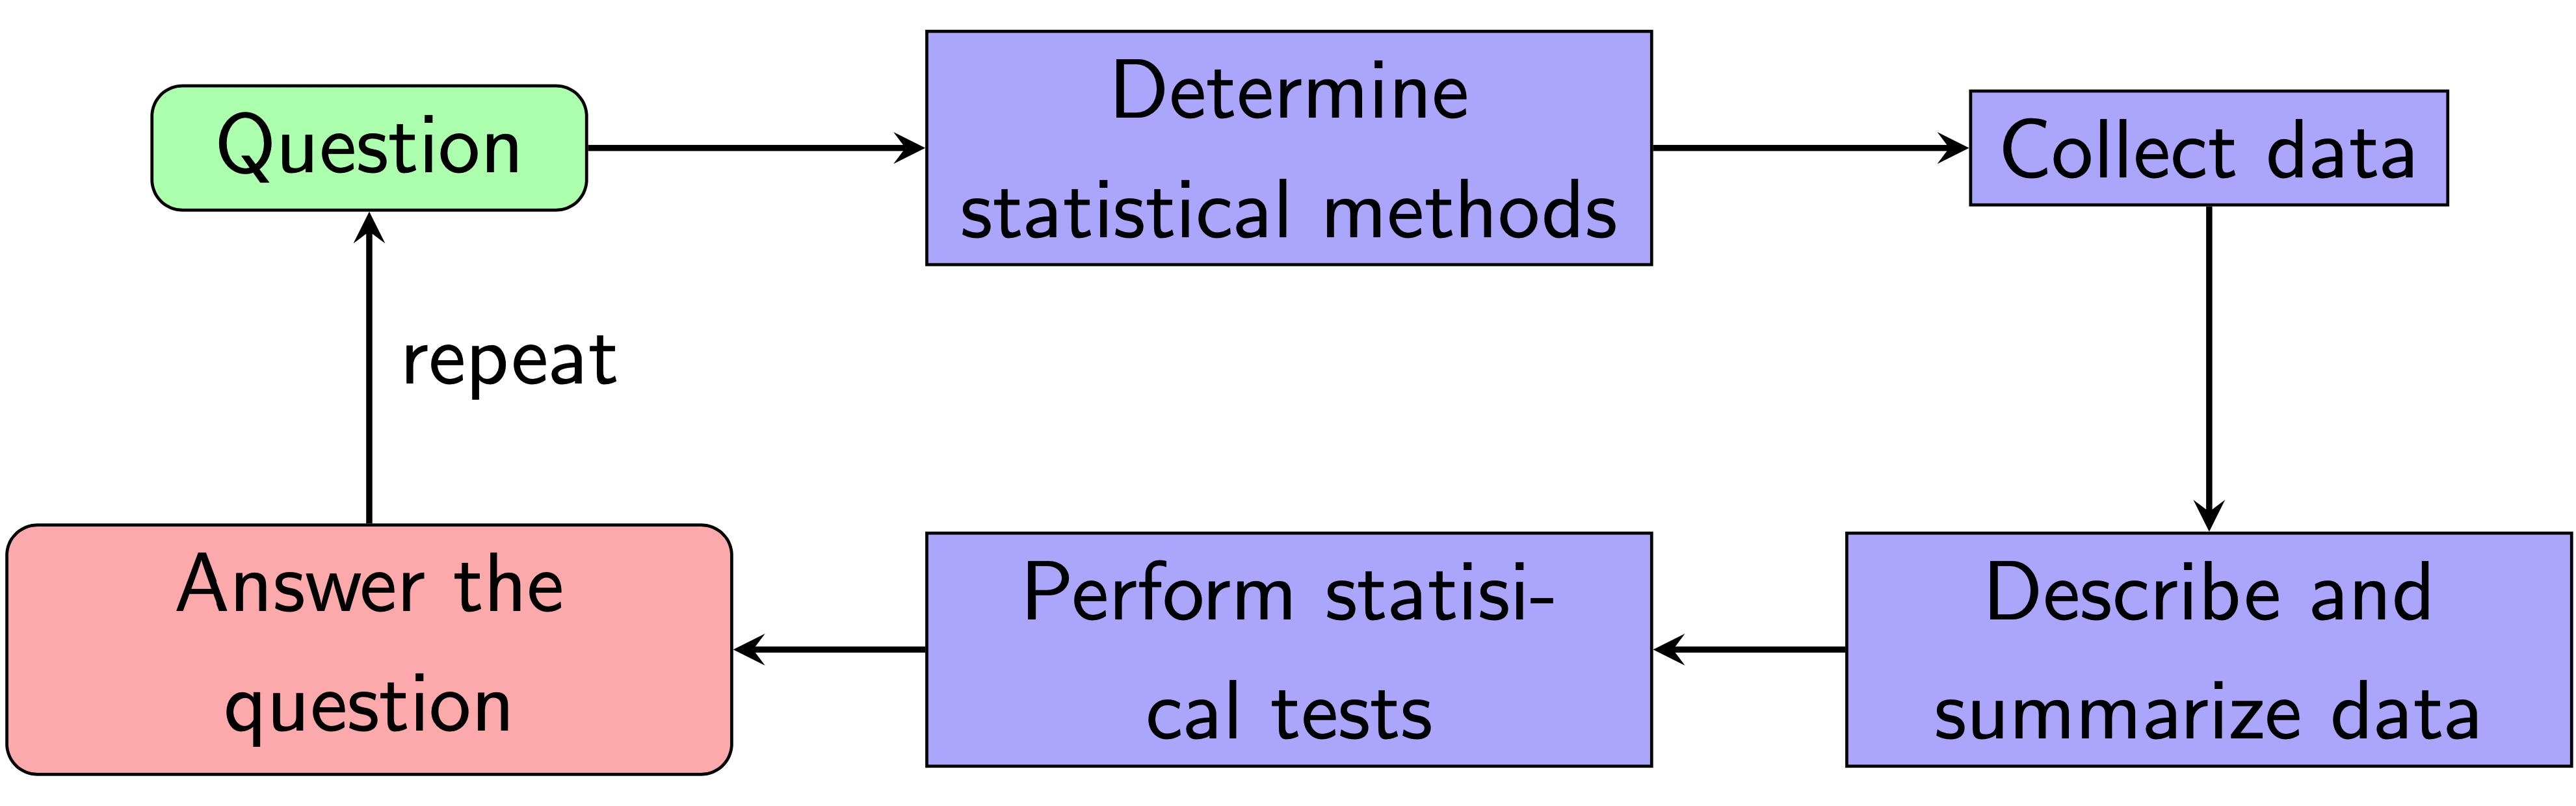
Figure 9.1: A pipeline for data-driven decisions.
9.1 Hypothesis testing
We often want to test our hypotheses in statistics. For example, we might create an experiment to test if a vaccine is effective at preventing COVID-19. If your results are not consistent, no one would want to use your vaccine. Here are some examples of hypotheses:
- If (I increase the concentration of this drug) then (the viral particles will decrease tenfold).
- If (I counsel patients instead of medication) then (their overall mental health score will increase by 5 points).
- If (independent variable) then (dependent variable).
In statistics, we have two types of hypotheses: the null hypothesis and the alternative hypothesis.
Null hypothesis (H\(_0\)). The hypothesis that there is no significant difference between specified populations (or expected value). That is, any observed difference is due to sampling or experimental error.
Alternative hypothesis (H\(_a\)). The hypothesis that the difference observed between expected and observed values are not due to chance alone.
Let’s work through an example: A researcher thinks that if COVID-19 patients get a vaccine early after diagnosis, their recovery period will be shorter. Average recovery times for COVID patients is 2 weeks for mild cases. Thus, our hypotheses are:
- H\(_0: \mu = 2\)
- H\(_a: \mu < 2\)
If the observed average recovery times is 1 week for patients who receive a vaccine for 100 patients, then we will likely reject H\(_0\). Otherwise, we do not reject H\(_0\). We NEVER accept H\(_0\). However, this example raises the question of when we should reject H\(_0\). This is where p-values come in handy.
9.2 P-values
P-values (informal definition). A p-value, or probability value, is the probability of the data being as extreme as it is. We use p-values to determine if our results are statistically significant. Since p-valuese are probabilities, p must be between 0 and 1 inclusive.
P-value (formal definition). The p-value is the probability of observing a sample as extreme or more extreme than the one observed, given that the null hypothesis is true.
Take a the following sleep experiment as an example. In this experiment, people try to memorize as many words as possible. Then, they are split into two groups that will either sleep 4 hours or 8 hours that night. The next day, the people try to recall as many words as possible. The following figure shows the results:
.](data/08_inferences/p_ex.png)
Figure 9.2: Figure retrieved from Prob(a)bilistic World.
The resarcher wants to determine if there are differences between the words recalled between the two groups. What are the hypotheses that we are testing in this experiment?
Let \(\mu_1\) and \(\mu_2\) be the average words the 4 hour of sleep group and 8 hour of sleep group receives respectively. Then,
- H\(_0: \mu_1 - \mu_2 = 0\)
- H\(_a: \mu_1 - \mu_2 \neq 0\)
Is this performance difference significant? If p = 0.01, it is likely significant. If p = 0.85, the difference is likely not significant. To compute the p-value, we will need to learn some statistical tests, which we will learn in the next chapter.
What did we learn from this example?
- A high p-value indicates a higher probability that your observations are likely to be observed.
- A low p-value indicates that your observations are NOT likely to be observed.
Check out this article if you want to read more about p-values.
9.3 Significance thresholds
Question: What is a “high” and “low” p-value? That is, how do we determine whether something is statistically significant?
Answer: You get to choose when a p-value is “low enough!”
Significance thresholds. Suppose we set a significance threshold, \(\alpha\). If p ≤ \(\alpha\), then we can reject the null hypothesis. Otherwise, we do not reject the null hypothesis. Further, if p ≤ \(\alpha\), our results are considered “statistically significant.”
Remarks:
- A high p-value does NOT mean your null hypothesis is true. Rather, it suggests the probability of observing your measurement is high.
- To beat a dead horse, let’s reiterate the following: we NEVER accept the null hypothesis.
- A confidence level is defined as \(1 - \alpha\), which tells us how uncertain we are about the true mean or median in a population.
- For example, an election article “38% of likely U.S. Voters now say their health insurance coverage has changed because of Obamacare”. If you scroll down to the bottom of the article, you’ll see this line: “The margin of sampling error is +/- 3 percentage points with a 95% level of confidence.”
At times, determining significance feels arbitrary. In a sense, it is! As scientists, we have to compare our p-value against a significance threshold that we set. For example, if our p-value is 0.08:
- If \(\alpha\) = 0.05, the result is not significant.
- If \(\alpha\) = 0.10, the result is significant.
- If \(\alpha\) = 0.08, the result is significant.
In academia, a common significance threshold is \(\alpha = 0.05\). Please keep in mind that there is nothing magical about having \(p < 0.05\). All it means is that there is a low probability that our observed data is less than our null hypothesis. Here is a meme I’ve curated for you to reinforce this concept:
.](data/08_inferences/pmorpheus.jpg)
Figure 9.3: Figure retrieved from imgflip.